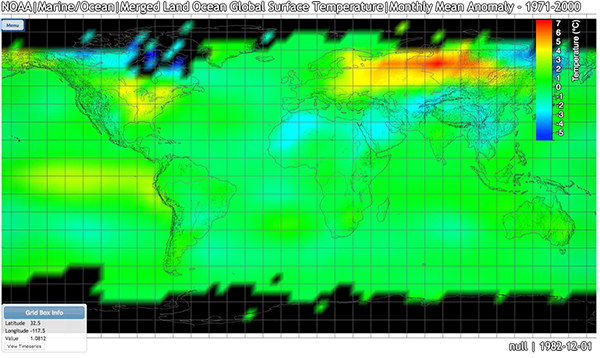
Figure: El Nino influenced December 1982 global temperature anomalies. The data are from the NOAA Merged Land Ocean Global Surface Temperature Analysis and are with respect to the normal temperature defined as the 1971-2000 mean. The red and yellow colors imply warmer than normal, the blue and green imply colder than normal, and black color indicates the areas without data.
Led by Sam Shen, SDSU has joined the research activities with the NOAA Cooperative Institute for Climate and Satellites North Carolina (CICS-NC) in 2016. A one-year funding of $100K has been allocated from the NOAA National Centers for Environmental Information (NCEI) to fund Dr. Shen’s work on the simplified and optimal analysis of NOAA global temperature data. The first year fund has been transferred to SDSU via a sub-contract through North Carolina State University.
Dr. Shen’s project is to simplify climate data analysis procures with short R programs, perform data validation, provide new insights of climate dynamics based on statistical data analysis assisted by global climate models, and develop new statistical and mathematical methods for quantifying uncertainties in various kinds of climate datasets. For this project, Dr. Shen’s group has already developed a visual delivery system for big climate data based on the internet technologies of distributed databases, web server, and web browser. The system will provide an easy platform to make a fast delivery of climate data to classrooms, museums, and households. The system can be incorporated into the NOAA’s big data project (BDP), partnered with Amazon, Google, IBM, Microsoft and Open Cloud Consortium. Dr. Shen will present this product at the CICS science meeting on November 29-December 1, 2016.